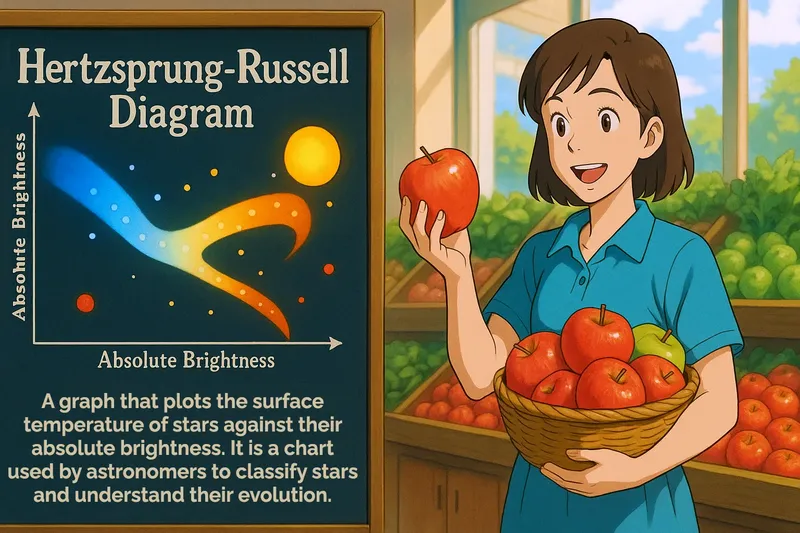
Hertzsprung Russell Diagram
Hertzsprung Russell diagram explained in an easy to understand way:


Imagine trying to choose the best apples at a grocery store, where you have to consider both their color and size. Just like you use these two characteristics to determine which apples are the freshest and juiciest, the Hertzsprung-Russell diagram uses the surface temperature and absolute brightness of stars to determine their type and lifecycle stage. In this analogy, the color of the apple corresponds to the star's surface temperature, and the size relates to the star's brightness, helping astronomers understand and categorize stars just as you would assess apples to pick the best ones.
Practice Version

Hertzsprung Russell Diagram: A graph that plots the surface temperature of stars against their absolute brightness. Hertzsprung Russell diagram. It is a chart used by astronomers to classify stars and understand their evolution.